Analyzing Netflix’s Userbase with Tableau Dashboards
–
This case study provides a data-driven analysis of Netflix’s userbase using a Tableau dashboard. It covers subscription revenue trends, user growth, regional preferences, device usage, demographic distribution, and retention metrics.
By leveraging interactive dashboards, stakeholders can identify market opportunities, optimize pricing strategies, and improve user engagement.
Dataset
The dataset, I sourced from Kaggle.com, which provides a snapshot of Netflix’s userbase, consisting of 2,500 rows and 10 columns, including:
- Subscription type (Basic, Standard, Premium)
- Monthly revenue
- Join date and last payment date
- Country and device type
- Account status
Dashboards
The Tableau dashboards (link available here) provide key insights into:
- Revenue and Subscription Trends – Identifying the most profitable plans
- User Growth and Retention – Understanding acquisition and churn trends
- Regional Subscription Insights – Analyzing plan preferences by country
- Device Usage Trends – Examining how different user segments engage with Netflix
- Demographic Distribution – Evaluating engagement patterns by age and gender
Metric
Revenue and Subscription KPIs
Total Revenue by Subscription Type and Region
ARPU (Average Revenue per User)
User Growth Trends (Monthly Sign-ups)
User Engagement and Retention KPIs
Churn Rate (Users who stopped paying)
Retention Rate (Users who continue subscribing)
Market Expansion KPIs
Regional Subscription Preferences
Device Usage & Streaming Trends
Preprocessing & Preparation
To ensure accurate and meaningful insights from the Netflix userbase dataset, I conducted a structured data preprocessing workflow in Tableau. This involved filtering, cleaning, standardizing, and transforming data to make it suitable for analysis. Below is a breakdown of how I conducted the process:
Data Import and Cleaning
Raw data often contains inconsistencies in formats and types. Before creating visualizations, I needed to ensure all data types were correct and standardized for Tableau processing.
- Connected Netflix_Userbase.csv (2,500 rows) to Tableau
- Validated data types:
- Join Date and Last Payment Date converted to date format
- Monthly Revenue ensured as numeric
- Standardized date formats for time-series accuracy
Converting Date Format in Tableau
Tableau does not always recognize non-standard date formats, which can cause errors in trend analysis. To address this, I manually converted the date strings into valid date fields.
- Used DATEPARSE to convert date strings into a proper format:
DATEPARSE(‘dd-MM-yy’, [Join Date]) - This ensures consistency across date fields for accurate analysis.
Creating Calculated Fields
Some key insights required custom calculations to measure user behavior effectively. Instead of relying solely on raw fields, I created calculated fields in Tableau for deeper insights.
Subscription Tenure: DATEDIFF(‘month’,[Join Date],[Last Payment Date])
ARPU Calculation: SUM([Total Revenue])/COUNT([Netflix Userbase.csv])
Total Revenue: [Monthly Revenue]*([SubscriptionLength]+1)
Dashboard Design
Revenue & Subscription Dashboard
Subscription Revenue & User Trends

Trends
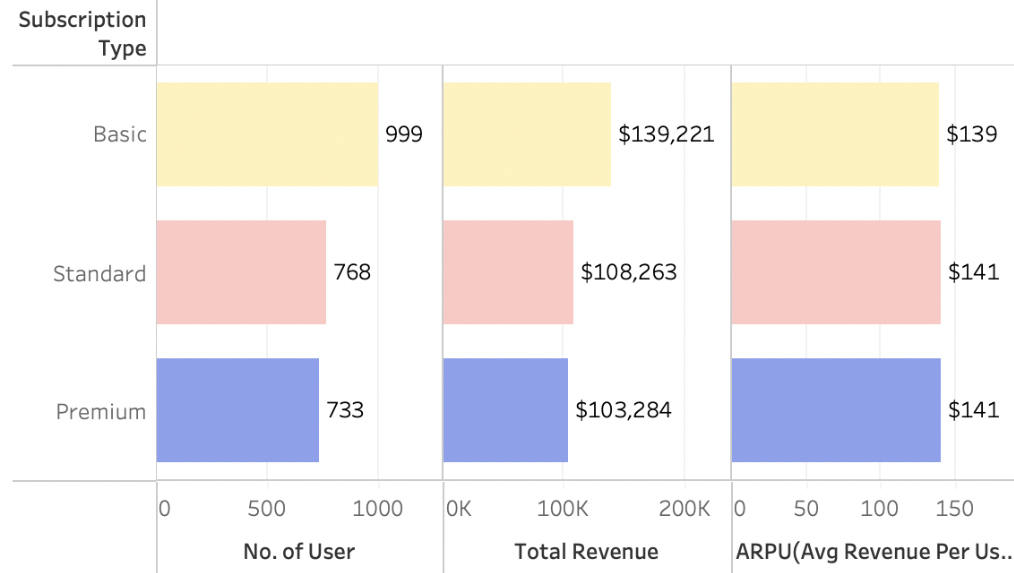
- Basic Plan: Largest userbase (40%) but lowest ARPU ($139), upsell potential.
- Standard Plan: Balanced userbase (30.9%) with ARPU ($141) matching Premium, solid revenue contributor.
- Premium Plan: Smallest user base (29.4%) but high revenue ($103,284) & ARPU ($141), high-value segment.
Recommendations
- Upsell Basic Plan Subscriber: Offer targeted promotions to move Basic users to higher tiers.
- Retain Premium Plan Subscriber: Enhance engagement with exclusive perks & loyalty rewards.
- Regional Expansion: Focus on regions with high Basic adoption to push upgrades.
Subscriber Growth Trends Over Time

📌 Trends
- July (481) & October (521) had peak sign-ups, indicating strong seasonal demand or effective marketing efforts.
- January-May had the lowest user acquisition rates, suggesting a potential engagement or marketing gap
📌 Recommendations
- Leverage Peak Months: Replicate July & October campaigns to boost acquisitions.
- Address Q1-Q2 Slumps: Launch New Year promotions, exclusive content, or referral incentives to drive sign-ups.
- Optimize Growth Strategy: Analyze content releases, competitor activity, and regional trends to refine future acquisition efforts.
Regional Focus Dashboard
Subscription Plan Performance by Country

Trends
- Basic Plan: Most popular in the US & Italy—these regions have the highest user count, revenue, and ARPU within the Basic plan segment.
- Standard Plan: Most popular in the UK & Mexico—these markets show strong engagement and revenue generation within the Standard plan.
- Premium Plan: Dominates in Spain, with the highest revenue and user count among Premium subscribers.
Recommendations
- Expand Premium Market in Spain: Promote 4K content, exclusive releases, and premium features.
- Upsell Standard Users in the UK & Mexico: Use bundles, discounts, or exclusive benefits to encourage upgrades to Premium.
- Optimize Pricing in Emerging Markets: Target Basic users in the US & Italy with upsell strategies or tiered pricing.
- Increase Engagement in Low-ARPU Regions: Explore localized pricing models and region-specific content investments.
Device Trends Dashboard
Device Trends by Subscription Plan

Trends
- Basic Plan: Device usage is evenly distributed across laptops (259), TVs (238), smartphones (251), and tablets (251).
- Premium Plan: Smart TVs (188) have high adoption, indicating a preference for large-screen viewing. Laptops (192) are the most used device, followed by Smart TVs (188).
Recommendations
- Enhance Smart TV Experience for Premium Users: Improve UI, 4K streaming, and exclusive premium content.
- Optimize Mobile Streaming for Basic Users: Improve video quality and data efficiency to enhance the mobile viewing experience.
Device Trends by Country

Trends
- Laptop & Smart TV: Highest usage in US & Spain, lowest in Brazil, Mexico, and the UK.
- Smartphone: Most used in US & Spain, least in Germany.
- Tablet: High adoption in US & Spain, lowest in Italy, Germany, and France.
Recommendations
- Optimize Smart TV experience in US & Spain, while enhancing mobile-first strategies in Brazil, Mexico, and the UK.
- Tailor content by region:
- Smart TV-dominant regions may benefit from longer, high-resolution content.
- Mobile-first regions should focus on shorter, data-efficient content.
Demographic Distribution Dashboard
Gender, Age & Revenue Trends

Trends
- Gender distribution is balanced across all key metrics* (ARPU, revenue, and user count).
- Users aged 26-30 show lower engagement, with slightly lower user count and revenue compared to other age groups.
- ARPU remains consistent across all age groups, indicating no significant revenue advantage by age.
- *Note: This may be influenced by data limitations discussed in the Reflection section.
Recommendations
- Increase engagement for 26-30 users with targeted marketing and content strategies.
- Maintain ARPU stability by ensuring consistent content offerings across all age groups.
Device Trends by Country

Trends
- Users aged 46-51 have the highest adoption across all devices.
- Laptop & Smart TV usage peaks among 46-51-year-olds, while younger users (26-30) prefer smartphones & tablets.
Recommendations
- Enhance Smart TV content for older users by investing in premium, long-form content.
- Optimize mobile experience for younger users by prioritizing short-form, interactive content.
User Retention Dashboard
User Growth Trends

Trends
- Data is primarily from 2022, limiting full retention analysis.
Recommendations
- Analyze multi-year data for a more complete retention picture.
- Assess marketing efforts in peak growth months to replicate success.
Churn Trends

Trends
- Last payment data available only from June to July 2022, making churn analysis incomplete.
- Retention trends may not fully reflect actual user drop-off rates
Recommendations
- Integrate full payment history for accurate churn analysis.
- Implement predictive modeling to reduce subscriber loss.
Insight
Revenue & Subscription Trends
- Basic Plan holds 40% of users but generates lower ARPU ($139), sugguests major upselling opportunity.
- Premium Plan accounts for 29.4% of users, yet contributes high revenue ($103,284) & ARPU ($141), sugguests high-value customer segment.
- Standard Plan provides a balanced userbase (30.9%) with ARPU matching Premium ($141), sugguests strong contributor to stable revenue.
Key Takeaway: Premium subscribers are Netflix’s most valuable customers, while Basic users present an opportunity for upgrades.


User Growth & Retention Trends
- Subscription growth peaked in July & October, indicating strong seasonal demand.
- Low user acquisition between January-May suggests marketing or engagement gaps.
- Churn data is incomplete, with last payment data only covering June–July 2022, making it difficult to analyze retention trends accurately.
📌 Key Takeaway: Stakeholders should capitalize on peak months and address off-season slumps while improving long-term churn analysis.
Regional Subscription Preferences
- Basic Plan is most popular in US & Italy, suggests upsell potential in these markets.
- Standard Plan dominates in UK & Mexico, suggests opportunity to move users to Premium.
- Premium Plan adoption is highest in Spain, suggests ideal market for promoting 4K & premium features.
📌 Key Takeaway: Stakeholders should tailor pricing and marketing strategies to regional user behavior to maximize revenue.


Device Usage Trends
- Basic users spread usage evenly across all devices (Laptop, TV, Smartphone, Tablet).
- Premium users prefer Smart TVs, suggests need for large-screen content.
- US & Spain lead in laptop & Smart TV usage, while Brazil, Mexico & UK are more mobile-first markets.
- Older users (46-51) favor Smart TVs & laptops, while younger users (26-30) prefer smartphones & tablets.
📌 Key Takeaway: Optimizing the Netflix experience by device type and age group will enhance user engagement and retention.
Recommendations
Executives & Strategy Teams
Maximize revenue by upselling Basic users.
Leverage Premium Plan’s high-value users with targeted retention efforts.
Expand localized pricing strategies in emerging markets.
Marketing & Growth Teams
Replicate successful acquisition campaigns in peak months (July & October).
Improve engagement for younger (26-30) and mobile-first users.
Target high-value Premium subscribers with exclusive offers.
Product & UX Teams
Enhance Smart TV experience for Premium users.
Optimize mobile streaming for younger, mobile-first users.
Refine UI/UX for different regional device preferences.
Data & Analytics Teams
Improve churn prediction models by collecting historical retention data beyond the available June–July 2022 snapshot.
Analyze regional & device-specific engagement to refine content recommendations per market.
Implement machine learning models to forecast user growth & churn trends and optimize personalized marketing efforts.
Reflection
This project showcased my ability to incorporate business analytics, workforce data, and qualitative research to drive real organizational change. By integrating workforce metrics, managerial feedback, and employee sentiment analysis, I helped leadership shift from gut-feel decision-making to a structured, data-driven approach, leading to sustained performance improvements.
Data Limitations
Incomplete Retention Data: The dataset only includes last payment data from June–July 2022, making it impossible to analyze long-term retention trends.
Limited Time Frame (2022 only): Excludes historical user behavior that could reveal long-term subscription patterns.
No External Factors Considered: The analysis does not account for competitor influence, content releases, or marketing spend impact on user growth & churn.
Analytical Challenges
ARPU Differences Are Minimal: While Premium and Standard plans have slightly higher ARPU, there’s no major pricing differentiation. A/B pricing tests could refine this further.
Regional & Device Engagement Needs More Depth: The insights lack user behavior tracking, such as watch time per device or content preference per region.
Areas for Improvement
Expand Time Frame for User Retention Analysis: Incorporate historical churn data to gain a more accurate view of long-term retention trends.
Deeper Behavioral Insights Needed: Track watch time per device & content category preferences to improve engagement strategies.
Predictive Analytics Integration: Use machine learning models to forecast future subscriber trends & optimize marketing spend.